Comments
Loading Dream Comments...
You must be logged in to write a comment - Log In
 Artist
import numpy as np import matplotlib.pyplot as plt from matplotlib.colors import LinearSegmentedColormap from mpmath import mp, mpc, mpf def mandelbrot_mp(width, height, max_iter, center_real=' -0.75035', center_imag='0.07109', zoom=mpf('5.009e633')): mp.dps = 700 # Digits for 10^633 precision; increase to 800 if artifacts center = mpc(center_real, center_imag) scale = mpf(4) / zoom # Extent ~4/zoom for symmetric framing half_scale = scale / mpf(2) # Precompute linspaces as lists for mpmath compatibility x_list = [mpf(center.real) + half_scale * (mpf(2*i)/ (width-1) - 1) for i in range(width)] y_list = [mpf(center.imag) + half_scale * (mpf(2*i)/ (height-1) - 1) for i in range(height)] iter_count = np.zeros((height, width), dtype=float) for row in range(height): cy = y_list[row] for col in range(width): cx = x_list[col] c = mpc(cx, cy) z = mpc(0) it = 0 while abs(z) <= mpf(2) and it < max_iter: z = z**2 + c it += 1 if it == max_iter: iter_count[row, col] = 0 # Inside: black else: # Smooth fractional iter mu = it - mp.log(mp.log(abs(z))) / mp.log(2) iter_count[row, col] = float(mu) # Norm with cycles for deep gradient layers (pink/red bulbs) raw_norm = np.log1p(np.abs(iter_count)) / np.log1p(max_iter) norm = (raw_norm * 5) % 1.0 # 5 cycles for recursion hues return norm # Parameters from sample (test low first!) width, height = 400, 400 # Start low; ramp to 800+ max_iter = 10000 # Test; set to 2146123 for full center_real = '-0.75035' # Paste exact long string here if found center_imag = '0.07109' zoom = mpf('5.009e633') # Or smaller like 1e10 for testing # Compute (slow—patience!) fractal = mandelbrot_mp(width, height, max_iter, center_real, center_imag, zoom) # Colormap: blue far → green/purple spirals → pink/red strawberry bulbs colors = ['#00008b', '#228b22', '#4b0082', '#ff69b4', '#b22222', '#ffff00', '#ff00ff'] cmap = LinearSegmentedColormap.from_list('deep_strawberry', colors[::-1], N=256) # Reverse for pink-high iter # Plot plt.figure(figsize=(10, 10)) half_s = float(2 / zoom) # Approx for extent center_r, center_i = float(center_real), float(center_imag) plt.imshow(fractal, origin='lower', cmap=cmap, extent=[center_r - half_s, center_r + half_s, center_i - half_s, center_i + half_s]) plt.axis('off') plt.show()
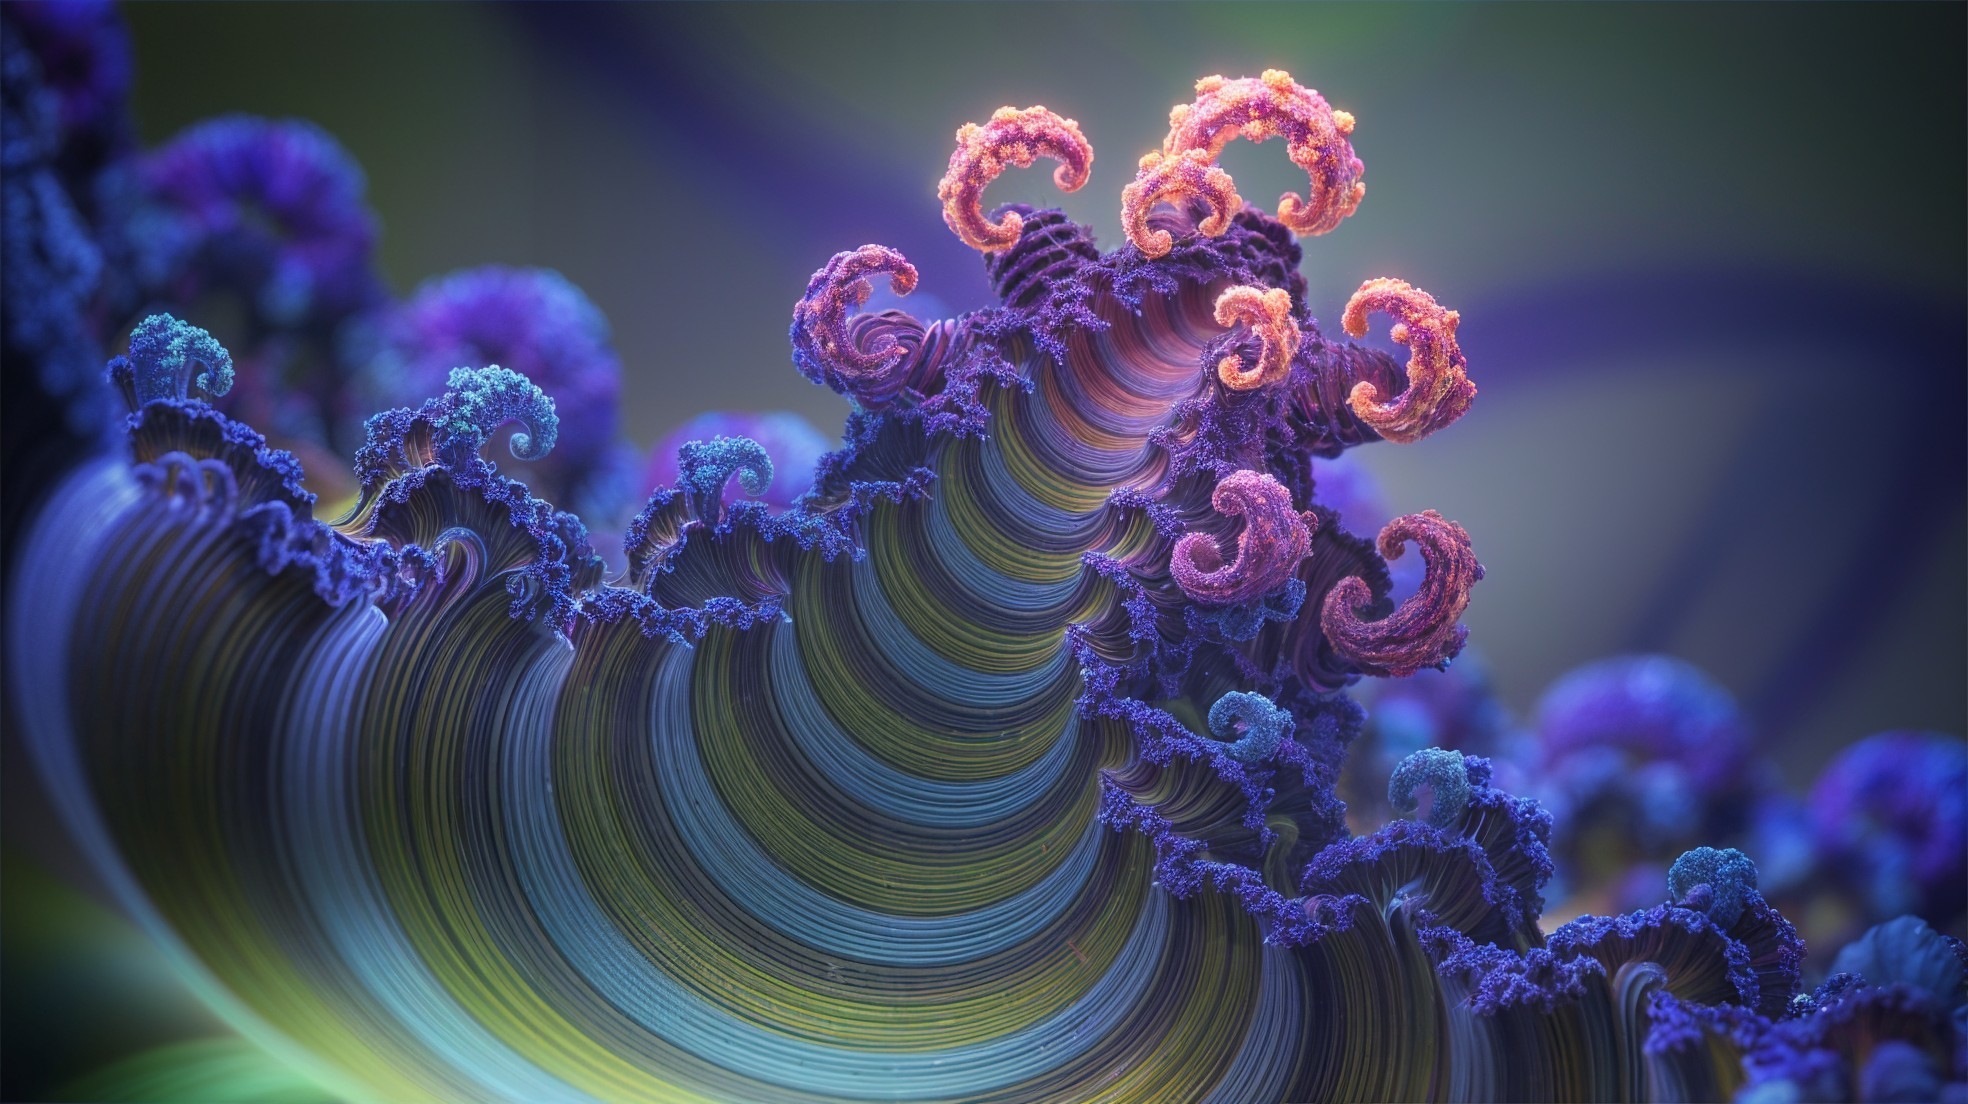
A vibrant, swirling fractal landscape showcases flowing curves and intricate patterns in shades of blue, purple, and pink. The design evokes a sense of depth and dynamic movement.


